

What correlates with changes in crime rates?
Testing the impacts of MPD staffing, temperature and unemployment

We’ve talked a lot about MPD’s hiring struggles and recently Mayor Bowser increased the hiring bonus for new recruits to $25,000. This won’t hurt recruiting but we’re probably well into the point of diminishing returns as DC engages in a bidding war with neighboring jurisdictions for a small pool of traditional applicants. I noted on Twitter that MPD officers’ complaints about MPD often focus on work hours and culture more so than pay and I doubt that this increase will significantly improve hiring. A lot of the coverage of this incentive cited the YTD increase in crime; as shown in this tweet:

Heather Curtis didn’t say that crime is up because MPD’s staffing is down but I imagine that many readers made that connection. More broadly, many people have a mental model of crime where “More Police = Less Crime” and the relationship between the two is simple, logical and strong. Since we have both crime and MPD staffing data by month we can actually test this relationship. As this post is rather long I will post the key findings up top but this issue is complicated and I hope you read through:
By itself, changes in MPD staffing levels correlate with ~2%-7% of the month-to-month changes in crime rates. Many other factors influence how police deter crime and preventative and societal factors also play a large role in crime rates. Staffing is a key part of the solution but it is only a part.
Even so, post-COVID changes in MPD staffing do have a statistically significant relationship with changes in crime rates, especially on property crimes
The connection between MPD staffing and violent crimes (especially gun crimes and homicides) is much weaker as these crimes are very hard to deter and often flare up due to gang/crew/domestic disputes
Post-COVID, there is a strong relationship between unemployment and most crimes; suggesting that DC’s relatively strong jobs market has helped reduce crime
As has been shown in many research papers, higher temperatures correlate with more crime and this is statistically significant for almost all types of crime in DC
Starting from the most simple model, here is how monthly MPD staffing compares with crime rates over the October 2017-February 2023 timeframe:

The very low R2 or “R-squared” value means that there’s very little direct relationship between these two variables. In layman’s terms, R-squared shows how much of the variation in the “Y variable” (crime in this case) is associated with the X variable(s) (MPD staffing in this case). So MPD staffing only “explains” ~7% of the changes in crime rates and honestly when a R-squared value is that low we’re generally hesitant to say if there is a relationship. Note that I did adjust for differences in the # of days per month and DC’s population over the October 2017-February 2023 timeframe where we have complete data. I also checked the months in 2021 and after to see if this relationship changed post-COVID:
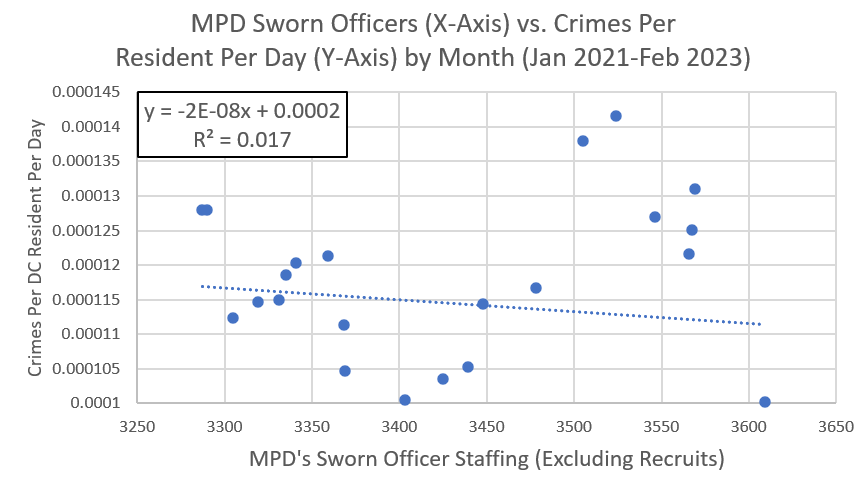
The R-squared value is even lower, though at least the coefficient is negative. I was somewhat surprised to see such a weak relationship but it makes more sense given some of the confounding issues we’ve covered previously:
We know that COVID had a huge impact on crime rates, pushing down property crimes (~87% of all crimes) and increasing violent crime rates
We know that policing has changed a lot with MPD’s arrests-per-officer falling by 44% since COVID as DCPU alleges officers are told “They want them sitting in their cars, sitting on the corner, and just telling citizens that they’re around.”
We know that MPD deployments don’t align well with where crime is happening. More officers in low-crime neighborhoods have very little impact on reducing crime in higher-crime neighborhoods (where MPD is often stretched thin).
We know that the United States Attorney’s Office (USAO) is pressing charges on many fewer arrests with them now declining to press charges 67% of the time.
We know that Federal agencies (not MPD) oversee people on parole/probation/release and their rearrest rate increased 20% in FY 2022 (mostly) independent of any changes at MPD.
We know that poverty, housing stability, truancy, mental health, substance abuse and the effectiveness of violence interruption programs all impact crime rates (relatively) independently of MPD’s staffing headcount.
All of these very real issues “confound” any “true” relationship between police staffing and crime rates. The most prudent interpretation is that how we deploy police matters as much (if not more) than how many police we have. One enormous note of caution is that this relationship is only weak within the range of the dataset where MPD staffing was between 3,300-3,700. With MPD shrinking month-after-month, every month we’re moving further and further “off the chart” and it’s very possible that the relationship could change. I still want MPD to fix its recruitment and retention problem to avoid a burnout-despair-resignation-burnout feedback loop among officers.
While “police headcount’s effect on crime is complicated by many factors” is a decent takeaway, I did want to see if I could build a statistical model that was at all representative of crime rates and had a R-Squared value that actually indicated it had any value. What I share below is not an academic-level study but it is reflective of the kind of analysis that is often “good enough” for many business and operational purposes. I hope that this helps explain which variables do correlate with crime rates in DC and maybe inspires some researchers to do a more sophisticated analysis.
I used linear regression for this analysis since it can help point towards which variables are statistically significant and it can give us an idea of how meaningful each variable is. Each data point here is a single month since that is the most granular level at which we have some of these key variables:
MPD staffing is updated monthly here. I use the total # of sworn officers excluding recruits since recruits aren’t “deployed.”
There are 3 months that were missing so to fill in the gaps I took the average staffing of the month before and after the gap. Month-over-month changes were always relatively small.
Average monthly temperature in DC from the National Weather Service. Temperature/seasonality has a well-known and significant impact on crime rates.
DC’s monthly unemployment rate from the Bureau of Labor Statistics via FRED
A binary flag for each month after COVID hit, starting in February 2020. This stands in for all of the societal disruptions that came with COVID (and had a clear impact on crime rates).
Note that we only have population estimates annually so each month within a year has the same population value when calculating “Crimes Per Resident”
As a baseline, our simple single-variable crime model that only had MPD staffing had a R-squared of 0.07 so our goal is to (significantly) exceed that without engaging in “p-hacking”. I’ll use “crimes per 100K residents per day” as the Y variable so the coefficients are easier to read with fewer zeros. I’ll explain the outputs below but for transparency here is the raw Excel output for the entire dataset (October 2017-February 2023):

The adjusted R-squared value of 0.45 is definitely an improvement but even together these variables don’t correspond with most of the variation in overall crime rates. Crime has many different causes so it should be no surprise that it is hard to model! Some of these outputs are outright bizarre and I don’t particularly trust them. MPD staffing comes out as not statistically significant and the coefficient is positive (implying more police = more crime). Even weirder, the unemployment rate shows a negative relationship with crime (implying unemployment reduces crime). Honestly I think my attempt to “control” for COVID failed and some of COVID’s crime-reduction got attributed to the high unemployment rate during early COVID. Let’s see how this model does on the January 2021-February 2023 timeframe (and dropping the COVID variable since that period is post-COVID):
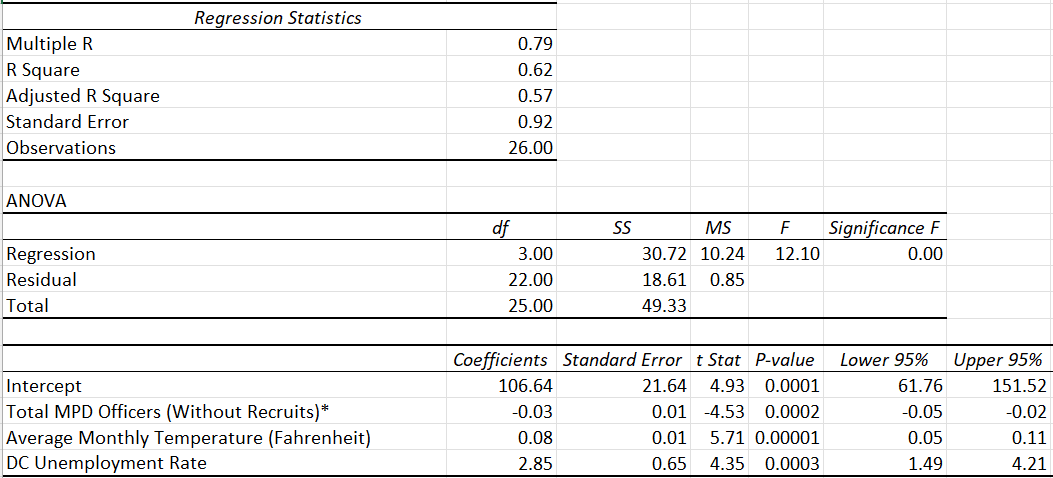
There’s a better R-squared value of 0.57, every single variable is statistically significant and direction of the coefficients actually make sense. So it definitely performs “better” as a model but it still can’t “explain” ~43% of the change in crime rates so humility is warranted. With that caveat, here’s what the model says about the significance and importance of each variable:
MPD Staffing: The P-value of 0.0002 is highly statistically significant (at the academic standard of 0.05 or less) and the coefficient is negative, implying “more police correlates with lower crime rates.” In layman’s terms, the P-value represents how likely it is that the statistical relationship isn’t real or is only due to statistical noise.
Temperature: Every 1 degree increase in temperature is associated with 0.08 more daily crimes per 100K residents. This is highly statistically significant by its very low P-value and it’s meaningful since going from a month with an average temperature of 50 degrees to 80 degrees is associated with an increase of ~490 reported crimes over the course of the month.
Unemployment Rate (UR): Every 1% increase in the unemployment rate is associated 2.85 more daily crimes per 100K residents. This is statistically significant with a P-value of 0.003 and pretty meaningful. A 1% increase in the unemployment rate is associated with ~582 more crimes each month.
One note of caution in interpreting this data is that the outputs significantly changed based simply on if we looked at the entire dataset or only the January 2021-February 2023 subset. I also tested how these variables performed with specific types of crimes for both date ranges:
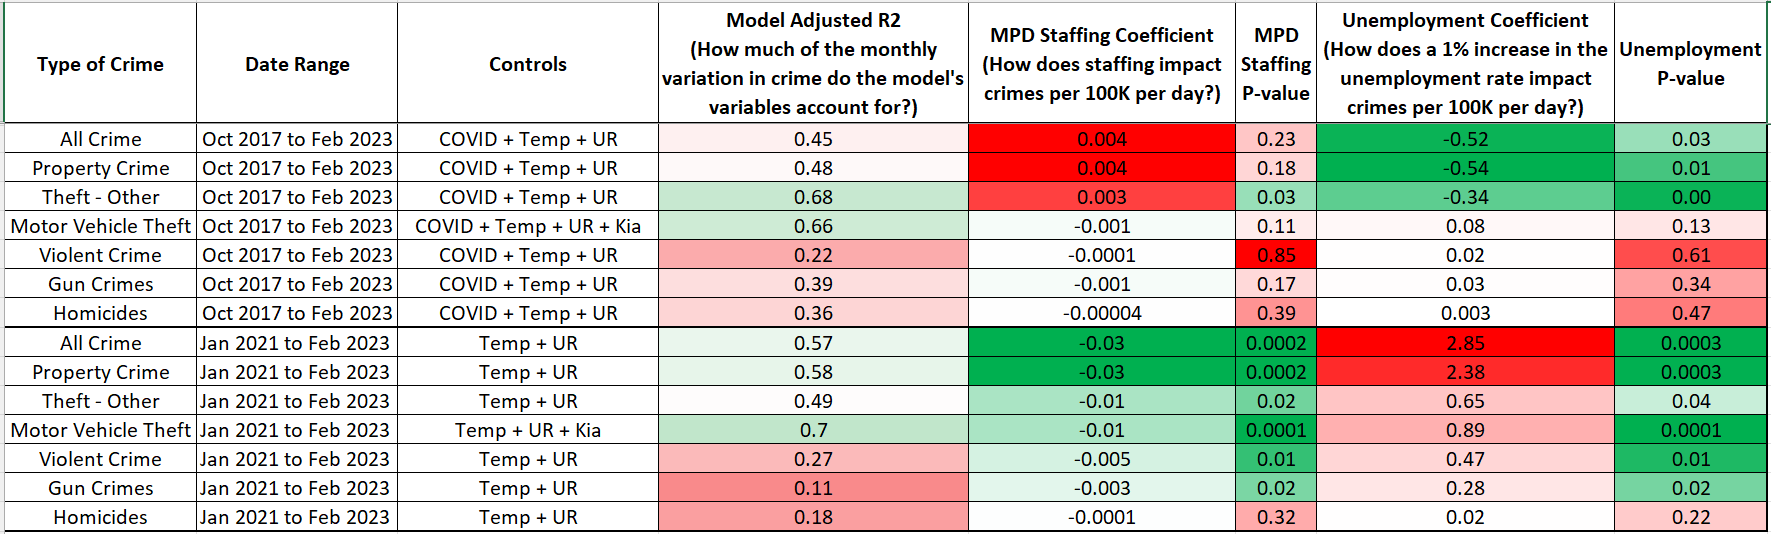
Here we can clearly see by the R-squared values that the variables in this model do a decent job of explaining changes in property crimes and a lousy job of explaining changes in violent crimes. The highest R-squared is 0.70 for “Motor Vehicle Theft” once I added a variable for the months after July 2022 when the “Kia Challenge” social media trend took off. Those videos glamorized this crime and educated (mostly) kids how to steal certain cars. Yes, a dumb Tiktok trend has a statistically significant effect on motor vehicle theft; MPD wasn’t just making that up.
It’s worth focusing on the fact that MPD staffing, temperature and unemployment do a very bad job (R-Squared between 0.11 to 0.27) of explaining changes in violent crime rates; especially gun crimes and homicides. This makes sense since we know that a lot of violent crime is driven by gang/crew fights or domestic disputes that don’t correlate with these larger factors and can flare up semi-randomly. The excellent NJCR report on gun violence in DC said “Often shootings are precipitated by a petty conflict over a young woman, a simple argument, or the now ubiquitous social media slight.” Preventing shootings requires extremely targeted efforts at the ~200-500 people that are responsible for 60-70% of the gun violence in DC. On the policing side, when problems with cases cause gun charges to be dropped and the Police Service Areas with 42% of the homicides have just 4% of MPD’s officers it’s not surprising that there isn’t a statistically significant relationship between MPD staffing and homicide rates. There’s a ton of work to do to prevent gun violence in DC and fixing MPD’s retention and recruiting problem is only one part of that overall effort.
To reiterate the obvious, this is not an academic study and I’m sure that many researchers could whip up a better model in R or Stata in a matter of minutes. I’m posting these initial results partially in the hope that it will prompt some researchers to do just that. For the rest of us I think there are some key takeaways:
Crime rates vary for a lot of factors and there’s no one simple input that can explain changes in crime rates
Property crimes, especially theft, can be better explained by macro factors like MPD staffing, temperature and the economy but violent crime has more complicated causes
Police headcount matters but it only partially reflects the impact of policing on crime
DC residents should be happy that police staffing isn’t the only key variable in crime. With MPD’s longstanding recruitment/retention problems, policymakers likely have more influence over the details of policing, prosecution and prevention than MPD’s future headcount in the near term.
For what it’s worth, I think temperature is really an attempt to measure “more people out and about, interacting”
Has there been any statistical impact from the shutdown of the vice squads back in 2014-2015? 2014 there were 105 murders and it's been a pretty upward trajectory since then.