Today we’ll look at property crimes across DC.
Property crimes are the vast majority of crimes. So far in 2023, 87% of all crimes have been categorized as property crimes and that is consistent with past years.
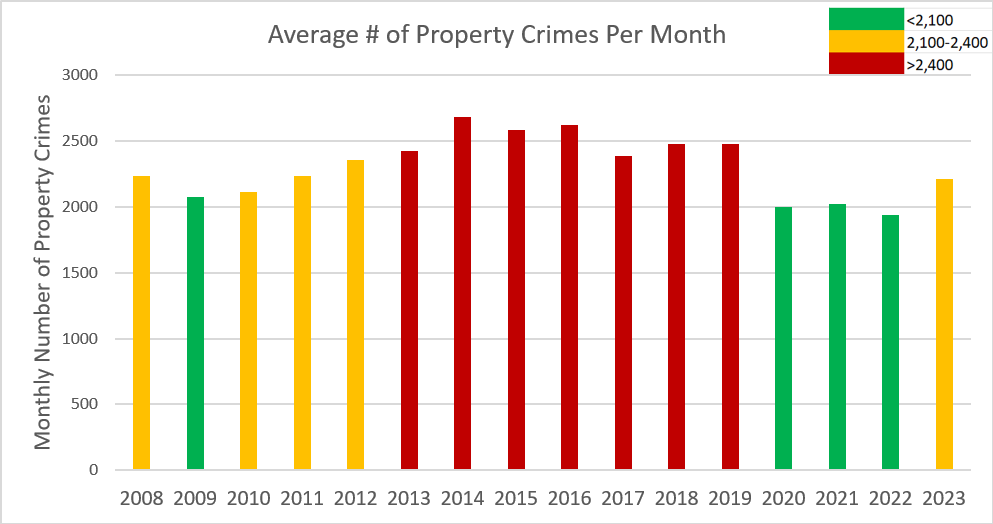
Reported property crime rates fell quite a bit during the COVID-19 pandemic, with 2020-2022 averaging 19% fewer property crimes each month than 2017-2019.
Over 50% of property crimes involve cars; either “theft from auto” (stealing items from a vehicle) or “motor vehicle theft” (stealing the vehicle itself).
Ward 2 has consistently had the highest share of DC’s property crimes, though that has come down some in recent years
Property crimes vastly outnumber violent crimes and reflect that for many criminals, most of the time, their motivations are materialistic.
Monthly data can get very “noisy” and there are also seasonal trends (Summer usually has higher crime rates). Looking at the monthly average for each year helps smooth out the trend and shows that DC had a period of elevated property crime from ~2013-2019. We had large drop in 2020 (almost certainly COVID-related) but then property crime stayed low for years before rebounding somewhat in 2023.
The 47% drop from January-April 2020 is further evidence that COVID and the resulting disruptions had something to do with “resetting” property crime to a lower equilibrium.
Interestingly, over 50% of property crimes now involve vehicles. Cars are unguarded for most of the day (and less protected than homes or businesses) so it’s logical that they are targets. Notably, MPD maintains that “Theft from auto” can be prevented:
The point isn’t to shame anyone who has experienced a theft from their car (it sucks), but to note that better practices and technology can help prevent this kind of crime.
In recent years there’s been a large increase in “motor vehicle theft”. There’s three distinct “phases” for this crime (the blue line on the graph):
~200 a month until May 2020
~300 a month but more variable from June 2020-November 2022
A sharp increase beginning in December 2022 and carrying into 2023
Another notable aspect of property crime is that where it happens doesn’t correlate with poverty in the way many people think. Wealthy Ward 2 has actually had the highest share of DC’s property crimes as far back as 2008 (which is as far as the data in DC Crime Cards goes). But that share has decreased some in recent years:
There’s remarkable consistency year over year. The only consistent trend is Ward 5 getting a slightly higher share of crime and Ward 6 getting a slightly smaller share.
Burglary and Arson are the two types of property crime we haven’t discussed and that’s because they’ve become much less common. Arson has always been relatively rare and recently DC has gone as long as 6 months at a time without a single arson. Burglary used to be much more common, with about 300 a month, but in the last year we’ve had ~85 a month. It’s possible that with more and better home & business security technology that some criminals have shifted from burglary to “theft from auto” in search of less-guarded targets.
That’s enough tables and graphs for now. Next time we’re going to start looking at MPD staffing and recruitment data. As always, your support and sharing is greatly appreciated!


