MPD Detective: “The people working the slow parts of the city are paid the same as the people getting ground into dust by the work load.”
How is MPD allocating its officers?
The quote above is from an anonymous MPD detective on Glassdoor and it prompted this analysis into how MPD officers are allocated across the District. Based on MPD’s staffing, crime and arrest data there do seem to be real disparities in workload that are worth investigating:
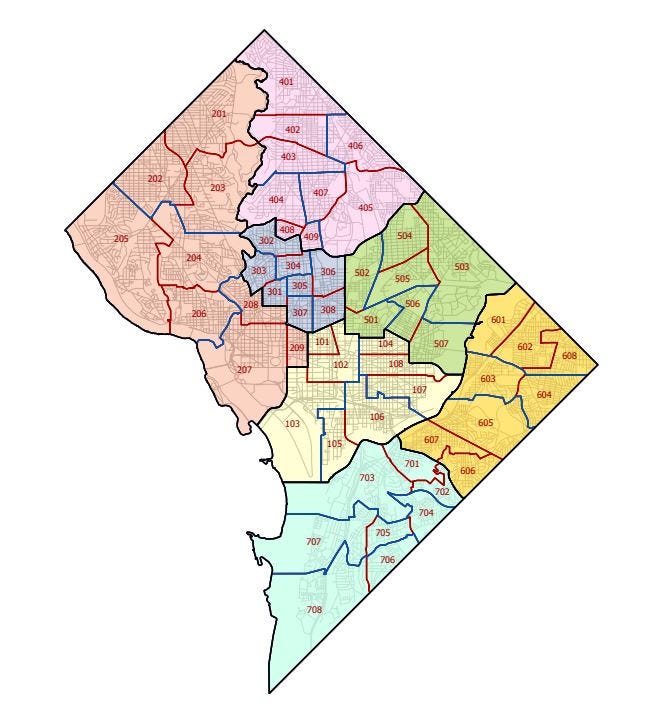
About half of MPD officers are assigned to one of 57 Police Service Areas (PSAs) across the District
MPD staffing varies a little bit by PSA but crime and arrest volume varies a lot
The 6 “busiest” PSAs averaged 42.5 reported crimes and 14.7 arrests per assigned officer
The 7 “least busy” PSAs averaged 11 reported crimes and 3.4 arrests per assigned officer
As a result, the officers in the busiest PSAs have ~300-400% more crimes and arrests to deal with than their colleagues in “slower” parts of the District
Since 2019, MPD has shifted about 100 sworn officers into centralized and support roles while “frontline” staffing has shrunk
That’s equivalent to pulling 4 average-sized Police Service Areas off the streets
At a very high level, ~62% of MPD’s 3,287 sworn officers are assigned geographically; to either one of the 57 Police Service Areas (PSAs) or one of the 7 Police Districts.
Most of the rest are assigned to specialized bureaus like Investigative Services or Homeland Security. All of the figures in this post are based on the latest February 2023 staffing report and it excludes the 99 recruits currently in training at the academy.
The critique that some MPD officers are assigned to areas with significantly more work than others inspired me to look at how staffing, crime and arrest rates vary by PSA. While it is 100% true that the task of responding to crimes or making arrests within a PSA won’t always fall on the officers assigned to that PSA; it still gives us a directional view of which PSAs may be “busier” than others. Because we’re only looking at the 47% of officers assigned to PSAs, the ratio of arrests-per-officer is higher than when comparing to all officers in MPD (like this post). Another caveat before diving into the data; this is NOT a staffing model. Police officers do a lot of things that don’t correlate with crime or arrest data and not every crime/arrest generates a similar amount of work. But the differences are so stark that there’s almost certainly some disparities here.
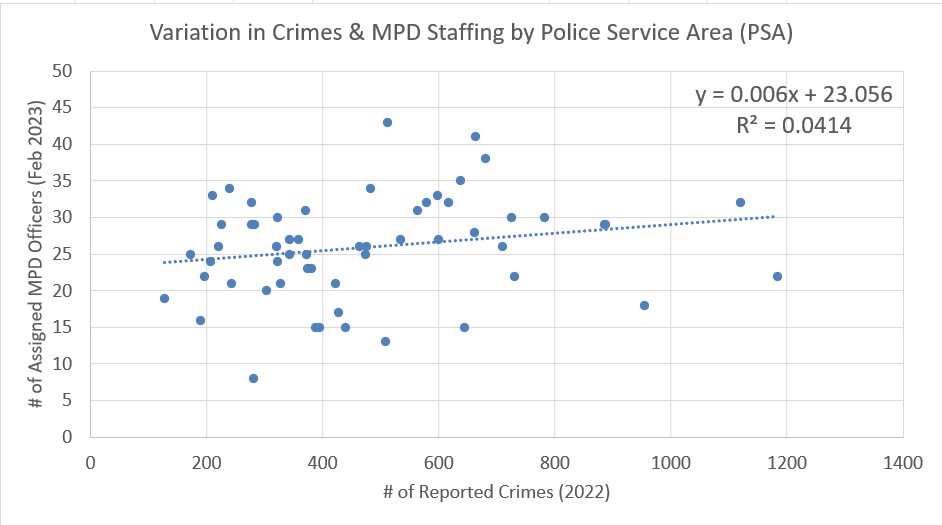
Since it wouldn’t be reasonable for police assignments to shift every month I compared the most recent staffing report (February) to crime and arrest data from calendar year 2022. The first thing is the # of crimes in a PSA has almost no relationship with the number of assigned MPD officers:
PSAs with more reported crimes don’t have more assigned MPD officers; the incredibly low R-squared value in the scatter plot indicates there is basically no relationship between these two variables
Here’s a look at how some of the most and least busy PSAs differ when we look at both crimes and arrests:
The 7 “least busy” PSAs averaged 11 reported crimes and 3.4 arrests per officer in 2022
The 6 “busiest” PSAs averaged 42.5 reported crimes and 14.7 arrests per officer
Officers in the busiest PSAs are responding to 386% more crimes and 432% more arrests per officer than those assigned to the least busy PSAs
Even if MPD is augmenting these PSAs with some centralized resources (like the Violent Crime Suppression Division), there’s still likely some large remaining disparities in officer workload
Let’s look at some of the largest contrasts:
PSA 205: Palisades, American University, Wesley Heights, Spring Valley
19 Officers who had 128 crimes and 61 arrests in 2022
PSA 107: Lincoln Park, Capitol Hill East
13 Officers who had 509 crimes and 333 arrests in 2022
One way to visualize these differences is to plot each PSA by its ratio of crimes and arrests per officer. This shows that there are 12 unfortunate PSAs in the upper-right red quadrant where they have both above average crimes and arrests per officer. In the lower-left green quadrant are the PSAs that have both below average crimes and arrests per officer.
This data certainly suggests that the anonymous detective was on to something when they said “The people working the slow parts of the city are paid the same as the people getting ground into dust by the work load.” Given the amount of work that goes into responding to crimes, making arrests and then supporting those cases as they move through the courts it would be very surprising if these large imbalances in crimes and arrests per officer didn’t also translate into an unequal workload. While MPD has many other duties, these are core parts of the job and the differences are stark. Since unequal workload can hurt morale, retention and operational effectiveness; this is worth investigating.
Another factor in MPD staffing is that ~100 more sworn officers are in support and administrative roles than there were in 2019:
Support and administrative roles are absolutely necessary but the large increases in these positions at a time when the overall force is shrinking is surprising. It’s especially counterintuitive that Human Resources would grow while the overall force shrank and that the Academy Division would be growing at a time when there are fewer recruits. This shift of 103 sworn officers represents the equivalent of 4 Police Service Areas moving into these roles. About 9% of MPD’s sworn officers are now in these divisions/bureaus while it was just 5% as recently as 2021.
Over the same timeframe MPD’s force structure has gotten a bit more top-heavy. In 2019 there were 190 Lieutenants, Captains, Inspectors, Commanders and Chiefs. Now there are 217 (a 14% increase) despite MPD’s overall staffing decreasing by 12% during the same years. Again, this is not necessarily bad but it is surprising given MPD’s overall staffing trajectory.
It’s worth reiterating that this analysis is not a staffing model. It’s very sad that the consultant the DC Auditor hired to study MPD staffing practices passed away recently and it’s unfortunate that the public doesn’t have a clear sense of what drives MPD’s workload or assignment decisions. But until we have that, the best we can do is compare some major components of MPD’s workload (crimes and arrests) to staffing assignments and ask questions. I hope that leaders in MPD and the District government take this seriously and look for opportunities to bring some relief to the officers “getting ground into dust by the work load.”
For residents and ANCs who want to see how your PSA compares here’s how you can replicate this analysis quickly:
MPD Staffing Reports are here: https://mpdc.dc.gov/publication/mpd-staffing-and-attrition-data
Scroll down to the “PSA Subtotals” and look for the “Sworn Total” column to see the number of officers in your PSA:
Crime data is here: https://crimecards.dc.gov/, change the “in” field to your PSA:


Your work is greatly appreciated, Joe. Thank you. This is quite an education and helps us understand our district better. Please keep it up!