Crime in Washington, DC: January & February 2023 Update
A deep dive into MPD's latest crime statistics
Now that we have two complete months of data in 2023, we can start to see how things have changed in the new year. This post is a wonky deep dive but here are the highlights:
Property crime is up 30% and violent crime is down 11% in 2023 (compared to the same months in 2022). Property crimes are much more common (87% of all crimes) so the overall crime trend is up 23%.
Wards 2 and 5 have the highest overall crime rates in 2023 (mostly due to property crimes) and Wards 7 and 8 have the highest violent crime rates.
Crime is heavily concentrated in certain neighborhoods. Half of all violent crimes occur in just 19% of DC’s census tracts.
The Metropolitan Police Department (MPD) does an admirable job of providing public data on crime through the DC Crime Cards website: https://crimecards.dc.gov/. All of the data for this post comes from DC Crime Cards and I primarily looked at January-February 2023 (since we only have a few days of March data so far). First I looked at how crime volumes have changed in 2023 relative to the same months in 2022 (we’ll look at seasonality in a moment):
The table below is sorted by which offenses represent the largest share of total crimes. Here we can clearly see that the vast majority of crimes (87%) are classified as property crimes instead of violent crimes.
Aside from burglary, all property crimes are up with motor vehicle theft unsurprisingly showing the largest increase; in part due to the “Kia challenge” social media trend.
Violent crime is mostly down due to decreases in robbery and assault (which are the vast majority of violent crimes). However, homicide is notably up from 29 to 33 in these months. Homicide’s percentage change fluctuates a lot more month-to-month because it is less common than other violent crimes.
Zooming out to look at longer trends, DC is currently averaging 2,209 property crimes per month; which is in between the two recent “equilibriums:”
From 2013-2019, property crimes averaged over 2,400 per month with especially bad summer crime rates
From 2020-2022, property crimes have averaged about 2,000 per month with much less seasonal variation than in the previous period
DC is averaging 327 violent crimes per month so far in 2023, which is lower than January-February 2022 and in line with the violent crime trend since 2017.
Sadly, homicides are not falling along with other violent crimes. There’s a lot of reasons why more assaults are resulting in homicides (more guns and deadlier guns for starters) but this remains at the more recent 2020 level of 16+ homicides per month.
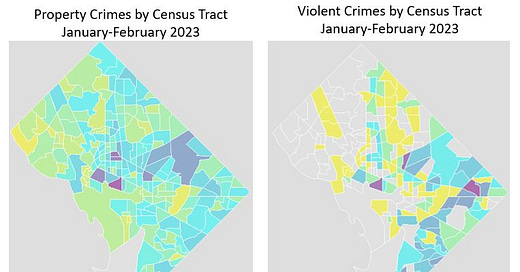
Looking at where crime occurs, there is a big divide between property crimes and violent crimes. Wards 2 and 5 have the highest number of property crimes while wards 7 and 8 have the highest numbers of violent crimes. Wards 7 and 8 represent 42% of all violent crimes in DC so far this year.
The maps also make it clear how concentrated certain crimes are in particular neighborhoods. Half of all crimes occur in just 25% of census tracts. For violent crimes it’s even more concentrated, with half of violent crimes occurring in 19% of census tracts.
Lastly, I looked at when crimes occur. Violent crime is more concentrated in the afternoon-evening. Surprisingly there doesn’t seem to be much “day of week” effect. Weekends and weekdays seem to have similar levels of overall crime so far in 2023.
That’s all the tables and maps I have for now. I’m planning on some deep dives into specific crimes like homicide and also to look at the data on MPD recruitment and retention. If you have feedback or ideas you’d like me to analyze please comment on this post or email me at DCCrimeFacts@gmail.com.


